Capture history
Extract opportunities and stage changes with source keys and business timestamps.
- Receives
- CRM opportunity and transition data
- Produces
- Current records and stage history

Connect funnel movement, pipeline quality and customer outcomes with definitions your teams share.
Let’s connect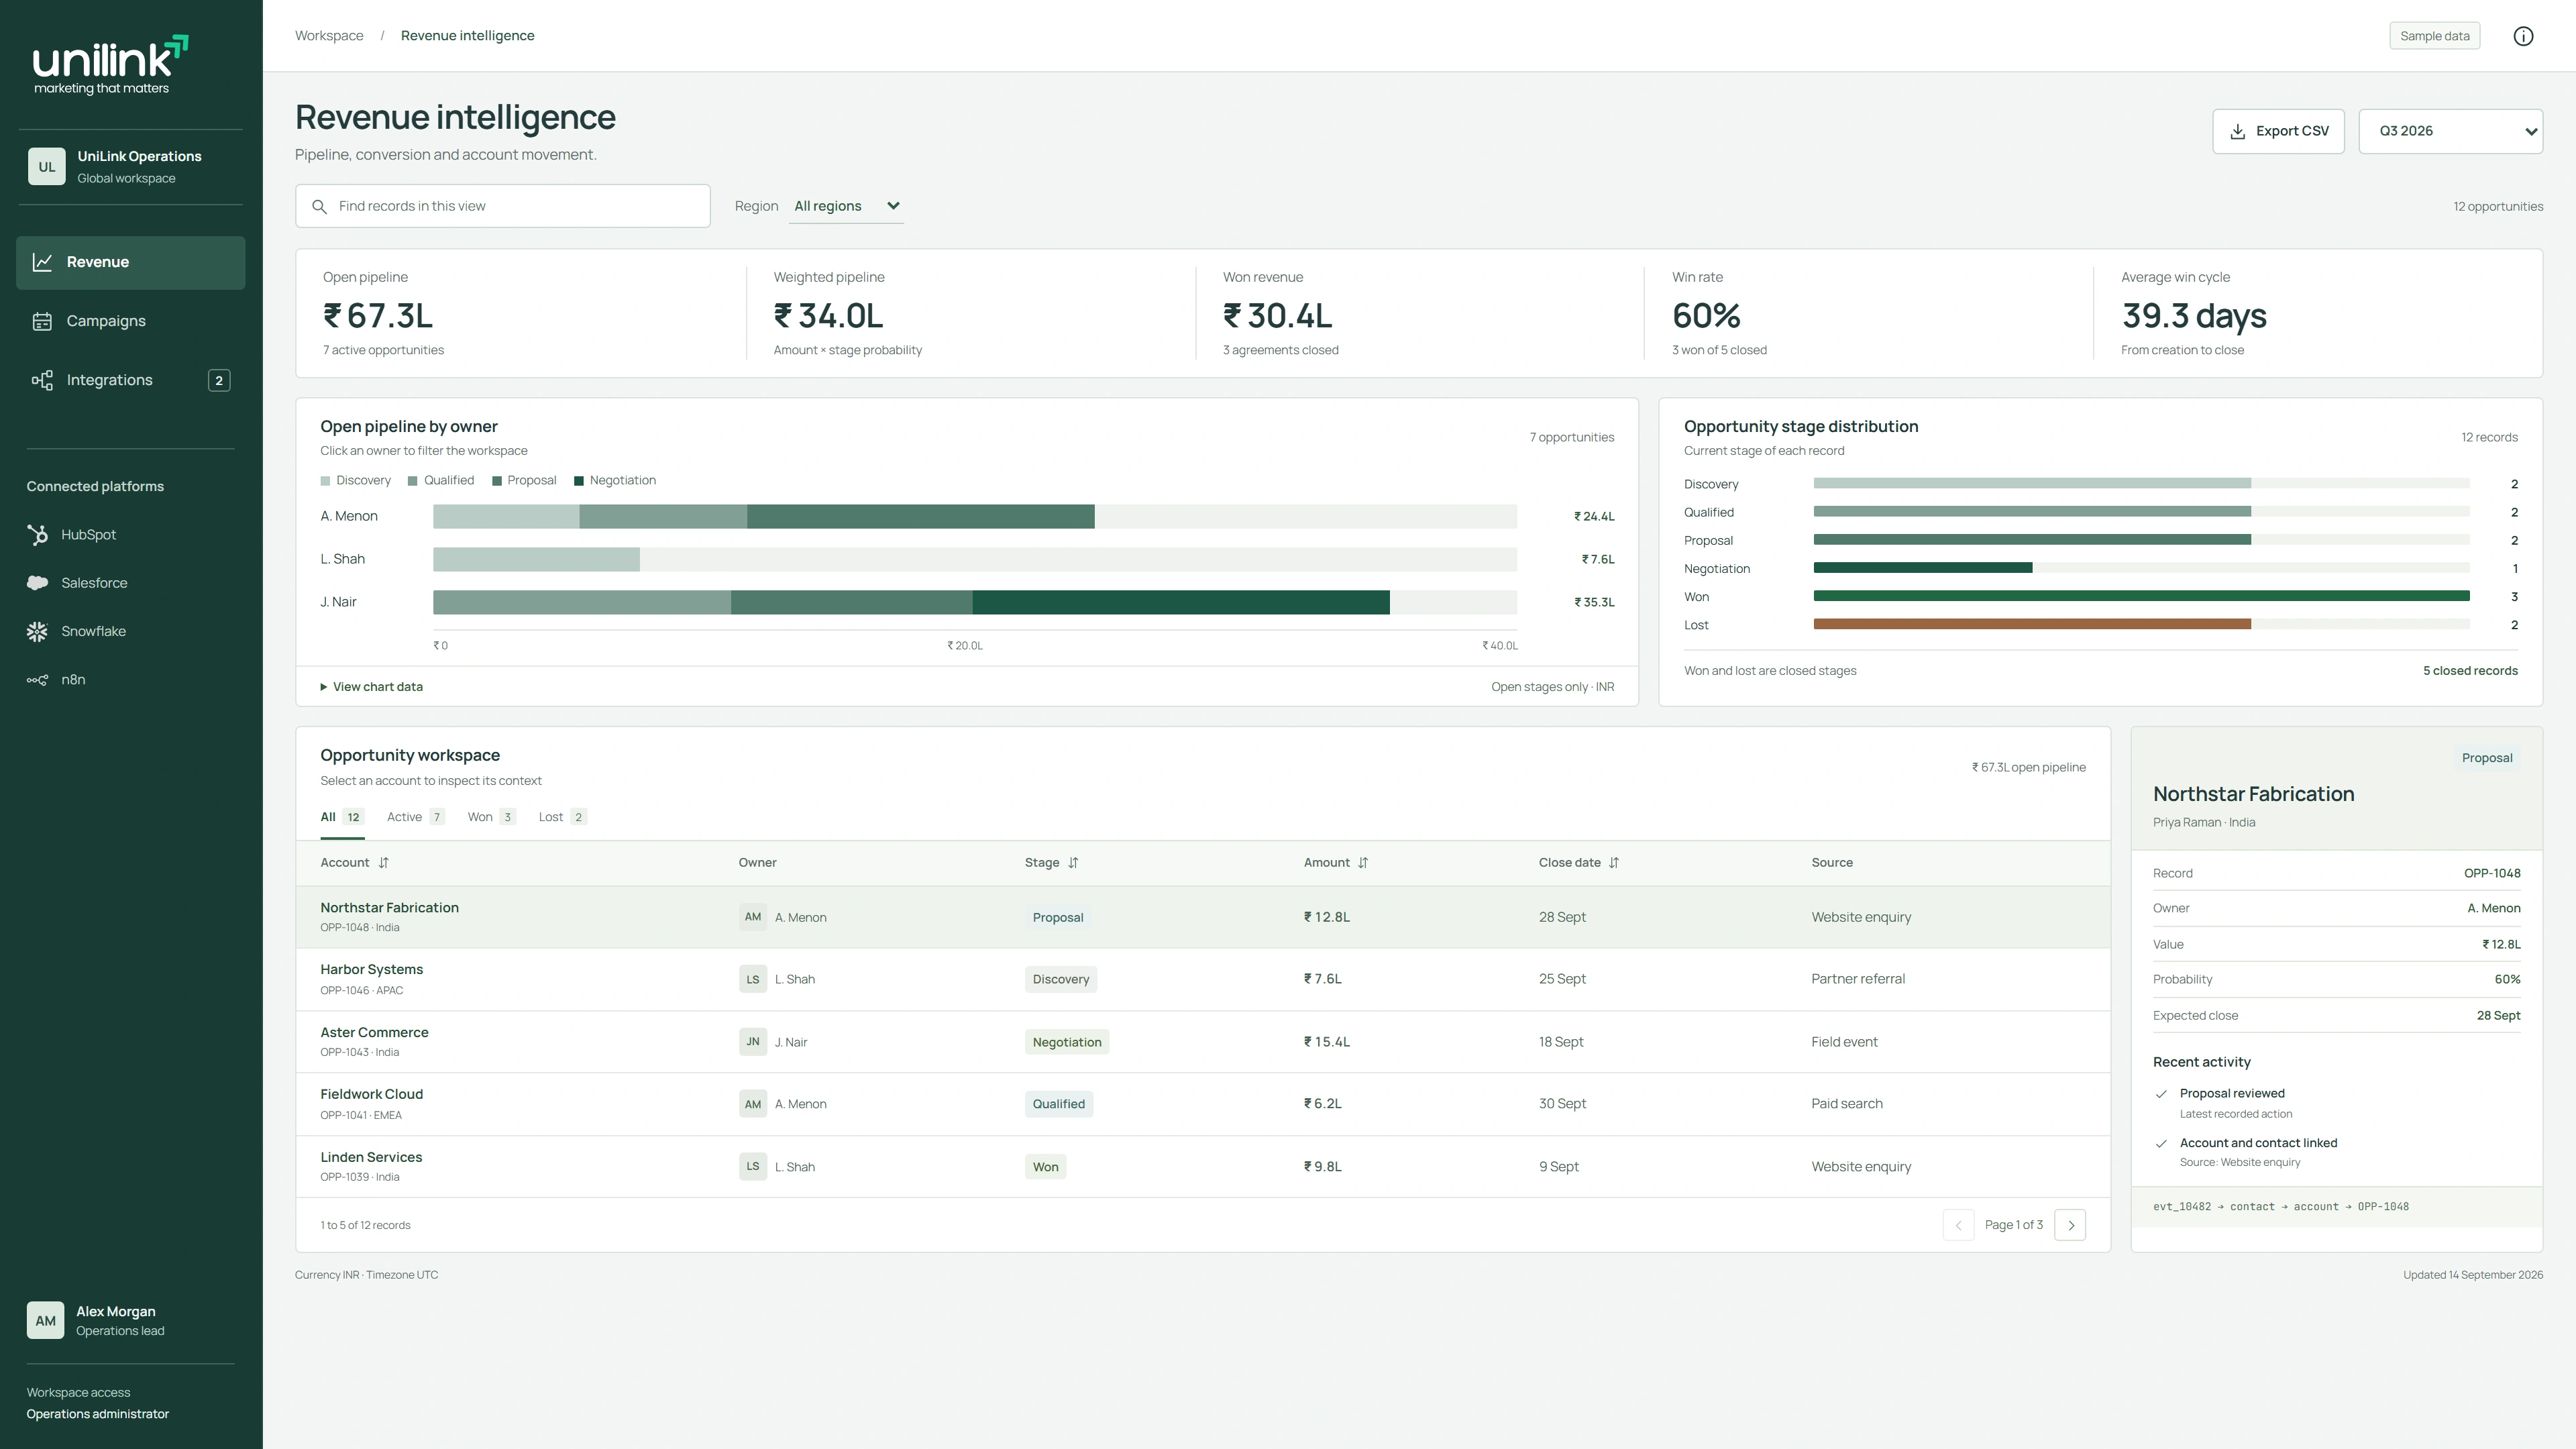
Connect current pipeline, historical movement and commercial outcomes without mixing their date roles or record grain.
Extract opportunities and stage changes with source keys and business timestamps.
Separate opportunities, accounts, owners and dates into defined facts and dimensions.
Define pipeline, conversion and velocity using explicit eligibility, currency and date rules.
Let users move from a headline measure to the contributing opportunities and operational exceptions.
Select a field to examine its owner, permitted changes and conflict handling. Clear ownership keeps updates consistent across systems.
| Field or object | Accountable owner | Mapping and control |
|---|---|---|
| CRM | Defines the grain of a pipeline record. | |
| CRM history | Measures transitions independently from record creation. | |
| Finance owner | Includes conversion date and exchange rate policy. |
A current pipeline total cannot explain how pipeline changed during a period. Preserve the events or snapshots needed for movement.
A summary view must not expose restricted opportunity details when a user opens the supporting records.
Select the scenarios to discuss with your implementation team.
Inspect the pipeline, campaign delivery and integration records. Change the view to explore the detail behind each decision.
Revenue reviews become more useful when the underlying measures are consistent. This solution organizes marketing, sales and customer lifecycle data into views that show stage movement, pipeline composition and operational gaps. It starts with a metric dictionary rather than a chart selection.
The reporting model can distinguish current pipeline from historical movement and separate person, account and opportunity measures. Filters, source references and refresh status help teams interpret the view and investigate the records behind a question.
Compare stage progression using agreed cohorts, time windows and denominators.
Examine age, stage movement, missing information and ownership within the opportunity pipeline.
Review acceptance, assignment and follow up against documented service expectations.
Expose definitions, source systems and refresh context alongside the reporting experience.
Agree the decisions, audience and metric definitions for each view.
Preserve lifecycle changes and align records at the correct analytical grain.
Use the dashboard to locate issues and trace them to source records or process decisions.
Read the contracts, controls and failure behavior behind a maintainable implementation.
A forecasting view can be scoped once stage definitions, historical data and assumptions are agreed. Forecasts should always be presented with their limitations.
Connect each measure to its definition, source records, reporting period and refresh status. Reconcile totals at the agreed grain, then provide a route from the summary to the records and rules that produced it.
Tell us where your operations are today. We’ll help you see what comes next.