
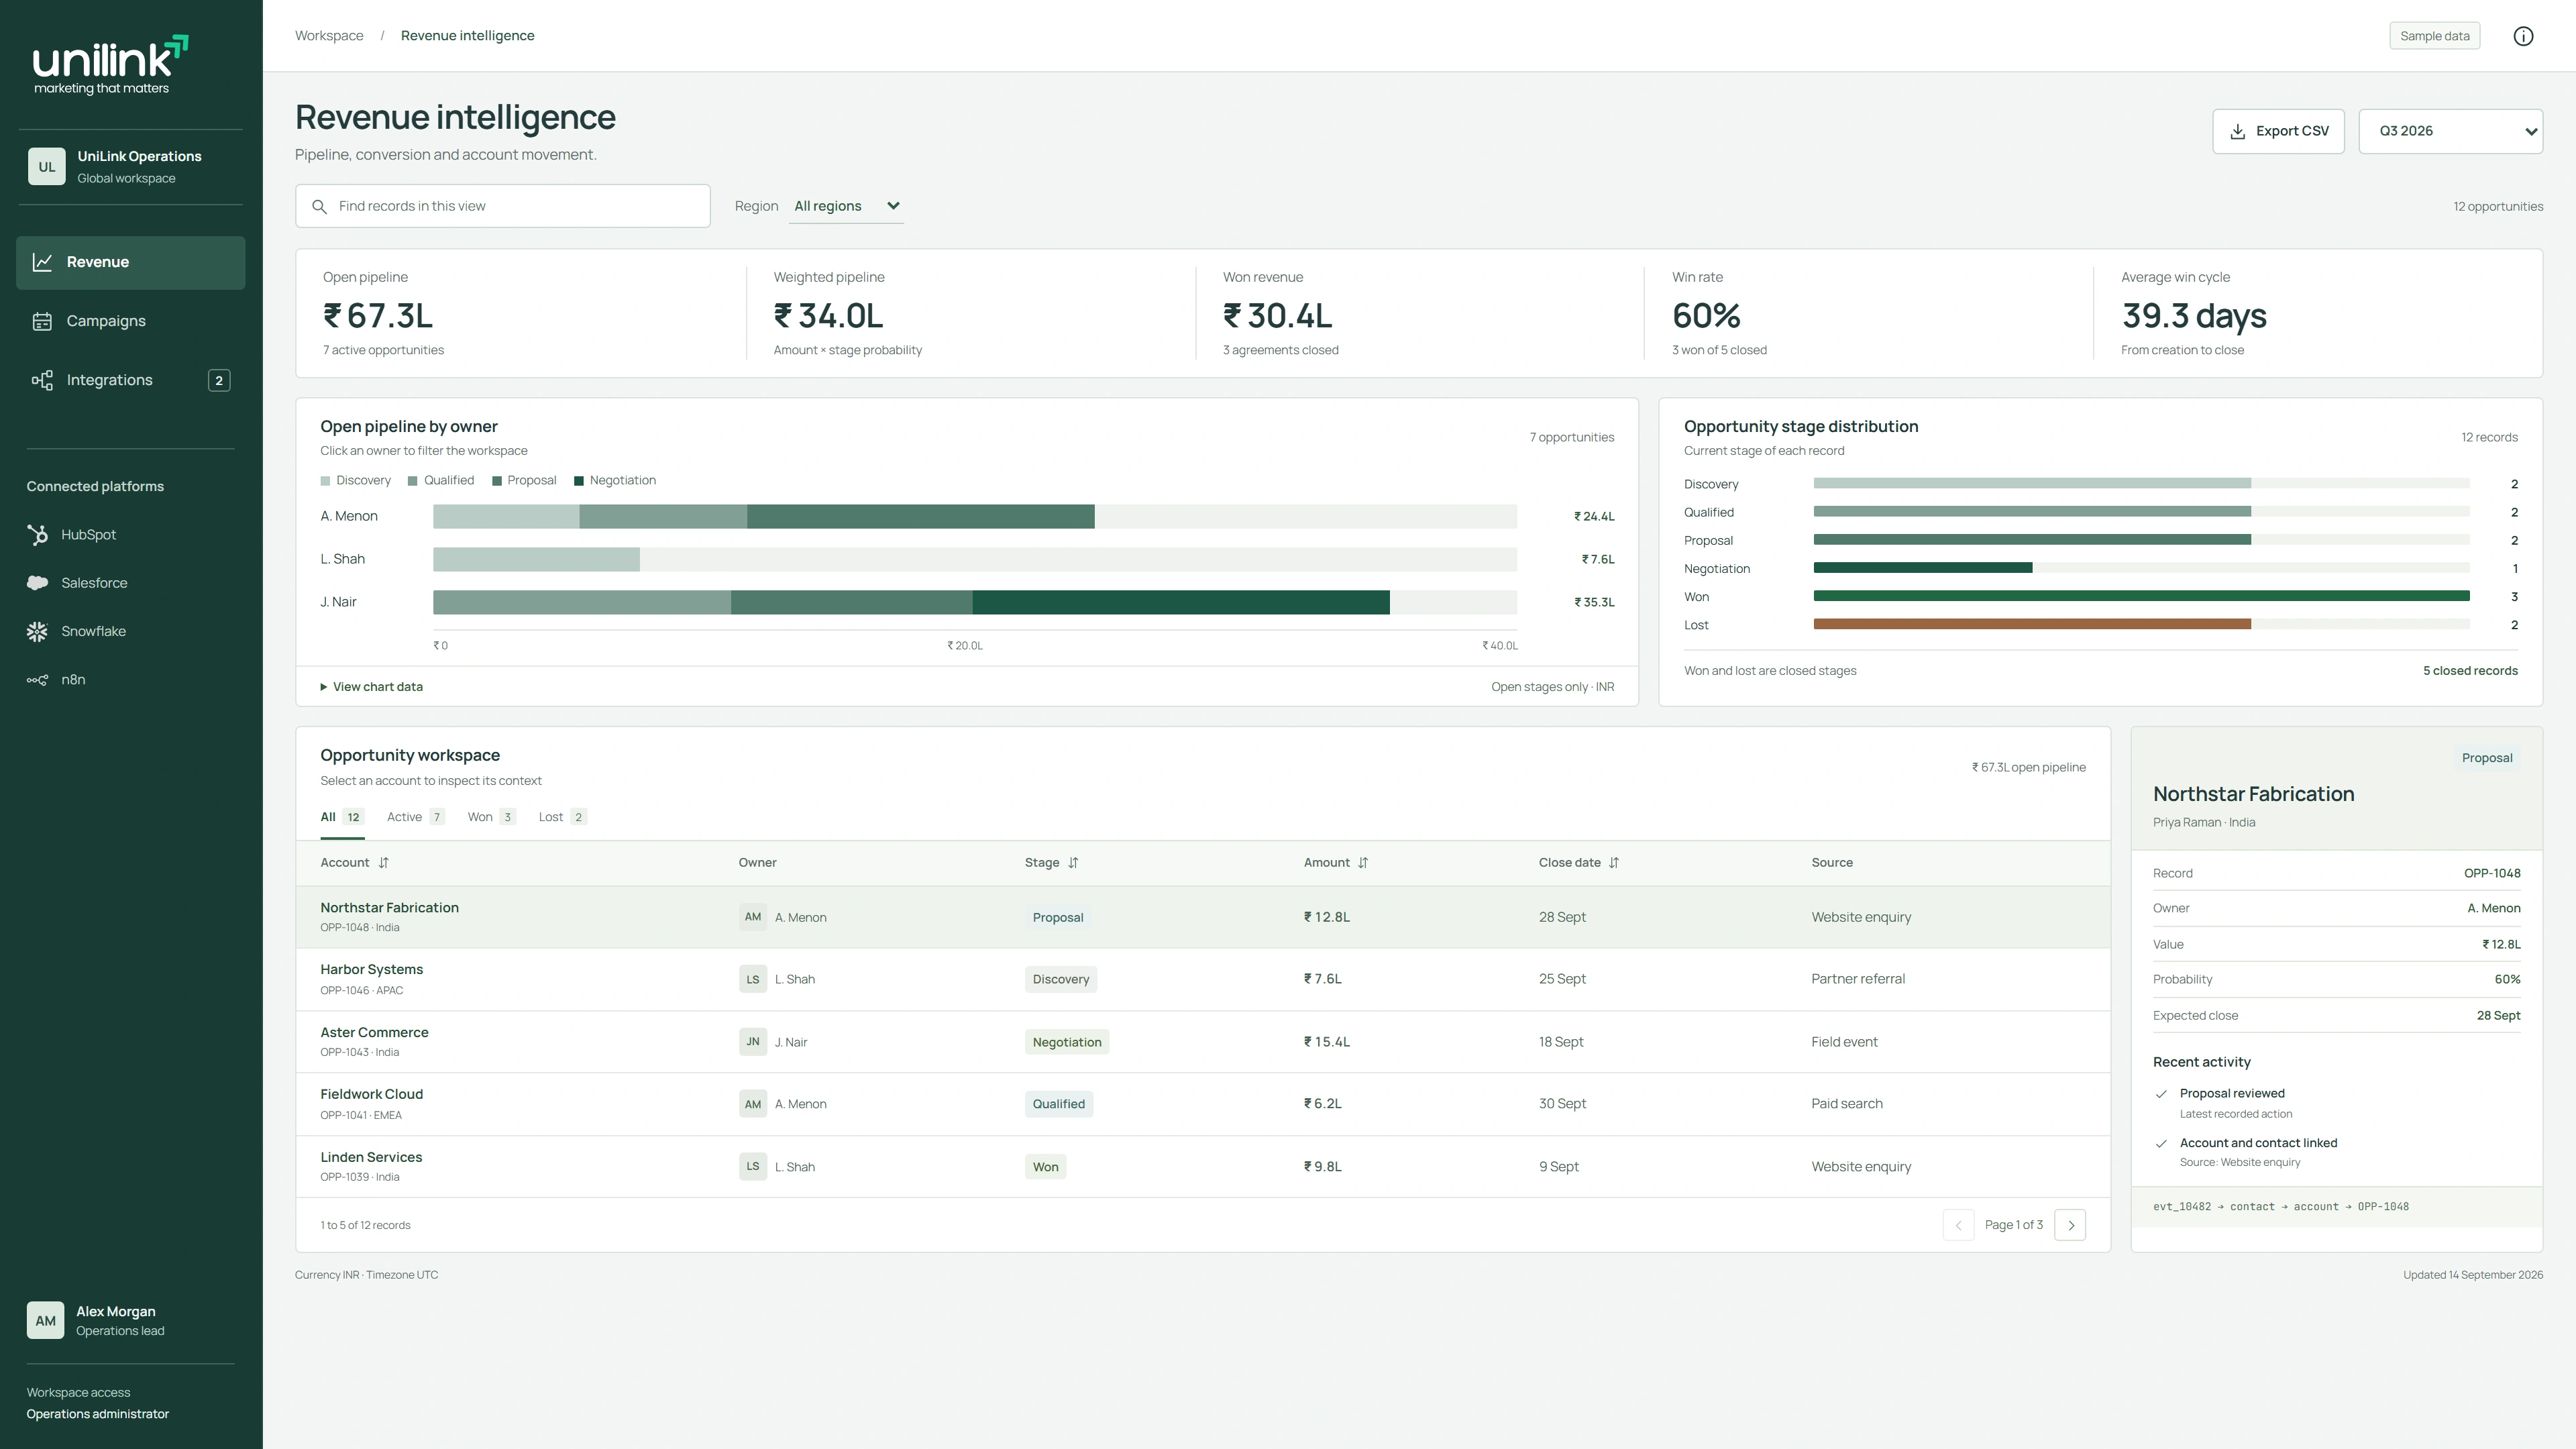
Turn each metric into a defined question
Start with the decision the report needs to support. A campaign manager deciding what to improve next needs a different view from a revenue leader reviewing pipeline coverage. Write the question, the expected action and the evidence required before choosing a visualization.
A metric definition should include the entity being counted, the calculation, the reporting period, the source and relevant exclusions. Conversion rate is incomplete without a numerator and denominator. Revenue is incomplete without the treatment of currency, cancellations and the event that makes it countable.
Give collection a documented structure
Create an event plan that names the meaningful customer actions and the parameters required to understand them. Distinguish an interaction from an outcome: viewing an enquiry form is different from submitting one, and submission is different from a qualified opportunity. Each event should have an owner and a validation method.
GA4 Measurement Protocol is intended to augment automatic collection through tagging rather than replace it. Validate representative payloads with the Measurement Protocol validation server before release, then verify the intended reporting view separately. The validation endpoint does not populate reports, and a structurally valid payload does not establish that every report has the required identity and session context.
Preserve identity and data grain
A campaign table, an event table and an opportunity table describe different things. Joining them without controlling those relationships can multiply rows and inflate reported totals. State the grain of each dataset and test how many records can match before calculating an aggregate.
Identity also determines coverage. A browser identifier is not automatically a person, and a person is not automatically an account. Document when and how an approved link can be made. Show the share or scope of data that remains unmatched where it materially affects interpretation, without presenting an uncertain association as a confirmed relationship.
Separate attribution from causality
An attribution model allocates credit among recorded interactions. Its output depends on the events captured, identity coverage, attribution window and chosen rules. It can help teams understand observable paths, but it does not prove that a channel caused an outcome.
Different platforms may count the same conversion under different windows and identity methods. Preserve those definitions when comparing reports. For questions about incremental effect, consider an appropriate experimental or broader measurement approach instead of asking a dashboard to establish a causal claim it cannot support.
Choose ingestion guarantees explicitly
A warehouse architecture also needs a delivery contract. BigQuery’s Storage Write API default stream uses at least once semantics. Application created streams can provide the supported exactly once behavior when the application manages stream offsets. These are configuration and processing choices, not a guarantee that every upstream event or downstream metric is automatically correct. Retain the source business key and reconcile the resulting records.
For change processing in Snowflake, a stream records an offset against source changes. Consuming it through a committed DML transaction advances that offset. Independent consumers should therefore have their own streams rather than accidentally sharing progress. Monitor stream staleness and document how to rebuild a consumer from an appropriate baseline. These operating details determine whether the dashboard can continue to show complete, explainable data after an interruption.
Make the reporting system inspectable
A useful report includes the reporting period, source context and freshness state. Its users should be able to find a definition and an accountable owner when a number looks unusual. Quality checks should cover missing values, duplicate records, invalid dimensions and delayed source feeds.
Treat a metric change like a product change. Record why the definition changed, when it became effective and whether historical results were recalculated. With those foundations in place, the dashboard becomes a readable view of a maintained measurement system rather than a collection of attractive but ambiguous numbers.